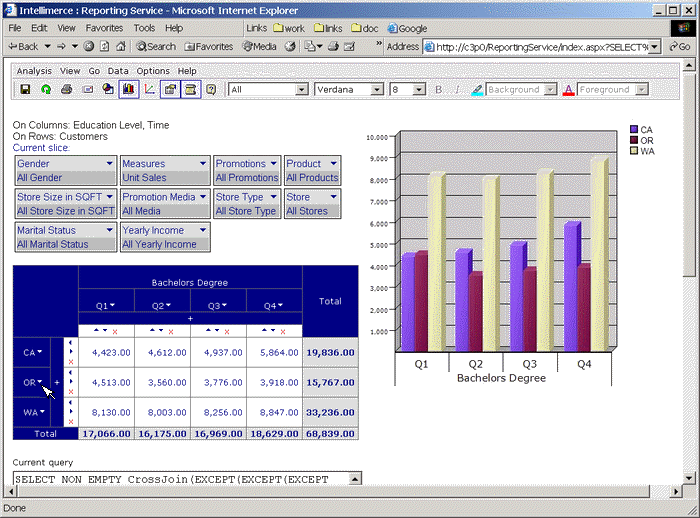
Drill-in directly in the charts by clicking on the chart items.
You can drill-in on the grid by clicking directly on the dimension member.
There is a significant difference between the drill-down and the zoom/drill-in. The drill-down leaves the existing level elements within the data set while displaying the break-down for the selected element. The zoom/drill-in removes the top level elements and shows the break-down for the selected elements. You drill-down by clicking on the down arrow, you zoom/drill-in by clicking on the element itself.
To demonstrate the difference lets start with the following dataset and drill-down on OR:

Here is the result of performing the drill-down by clicking on the down arrow in the OR member on the Y-axis.
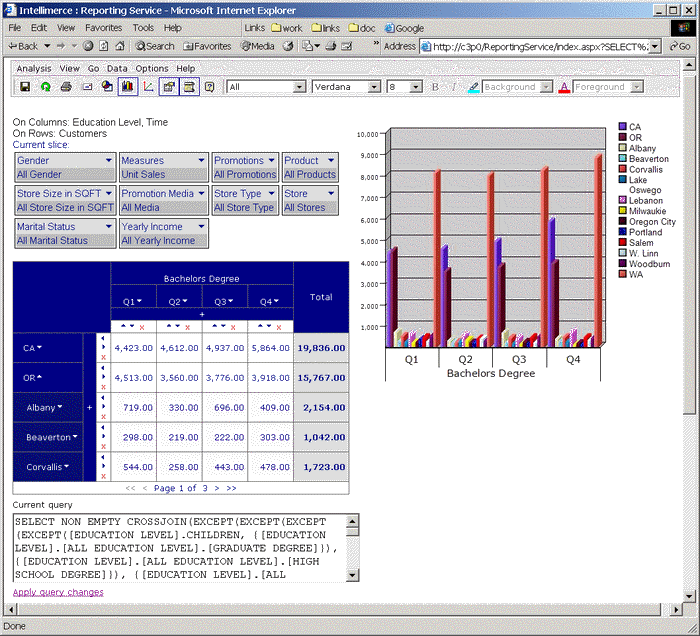
You can see both the higher level members such as CA, OR, WA as well as the children of the OR.
On the other hand performing zoom/drill-in by clicking on the OR itself (not on down arrow) results in following dataset:
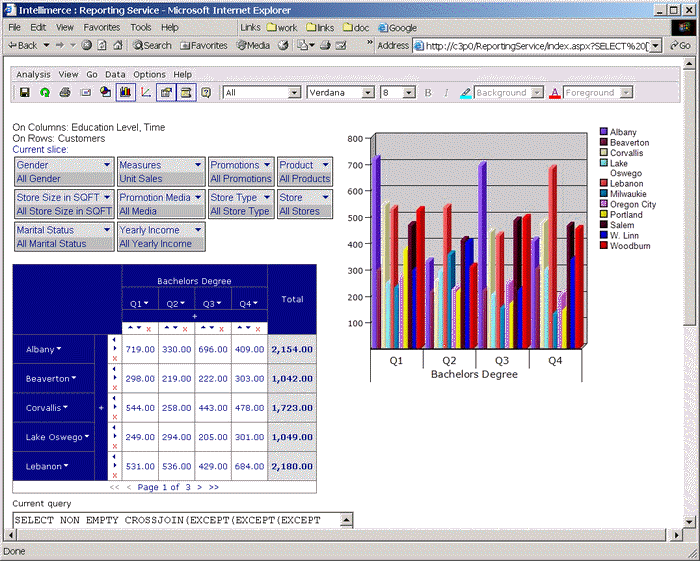
One of the powerful features of Reporting Services is the capability of performing the analysis by either using the grid or the chart. Regardless of the source of the action both views are always synchronized.
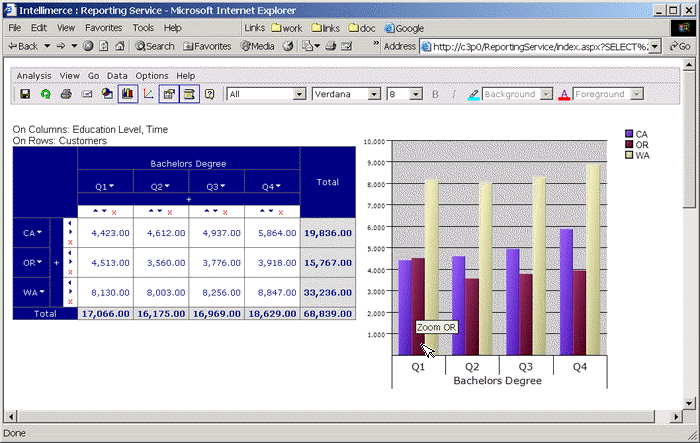
The chart view provides the same zoom/drill-in capability. For example, here is a page with both the grid and the chart displayed. For example, here is how you would perform the zoom/drill-in for OR in the chart. Starting from following view:
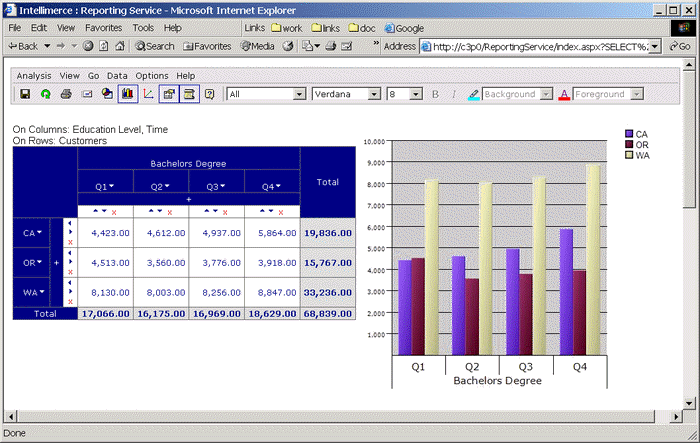
We are hovering the mouse over the last bar in Q1 which represents OR sales. Simply click on the second bar in the Q1 group on the chart such as this:
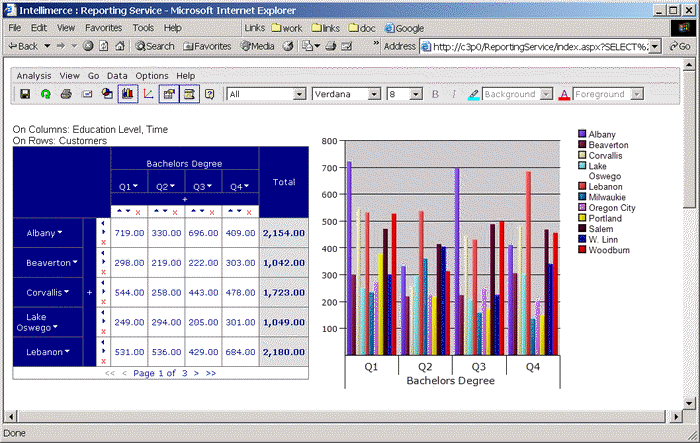
Which results in the same view as what we have achieved using the drill-in with the grid:
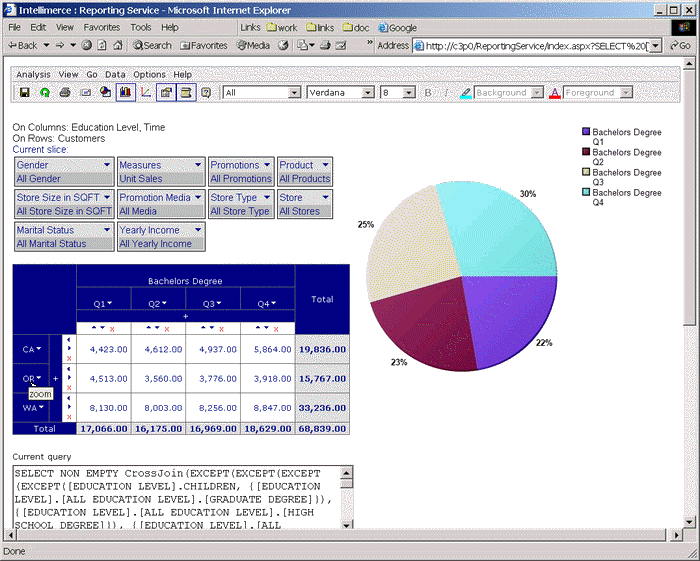
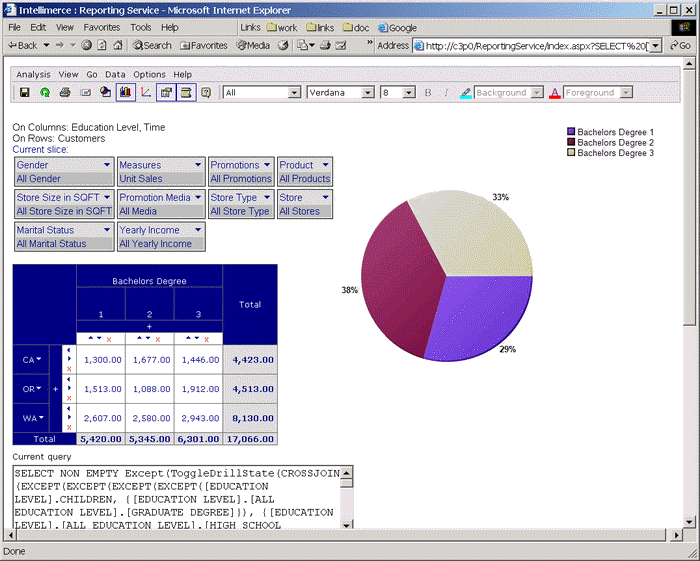
Drilling in charts is very natural when using pie charts. So, lets try to use pie chart, starting with the following dataset and zoom on OR:
After zooming on OR in the grid:
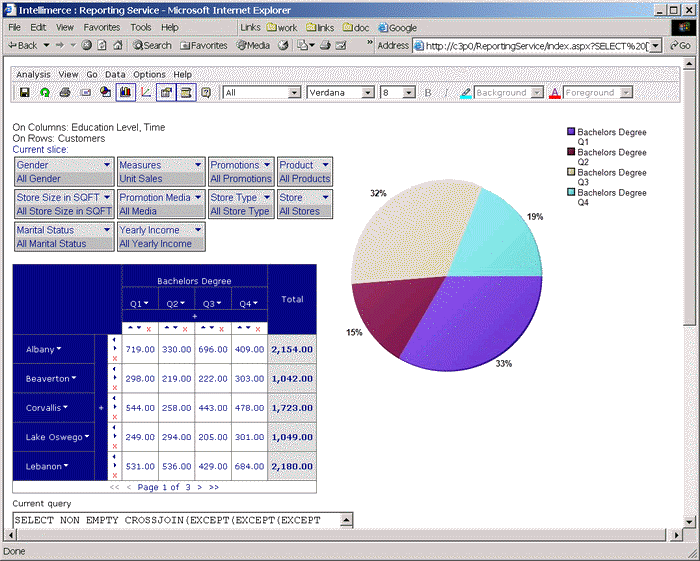
But when zoom in the chart on Q1:
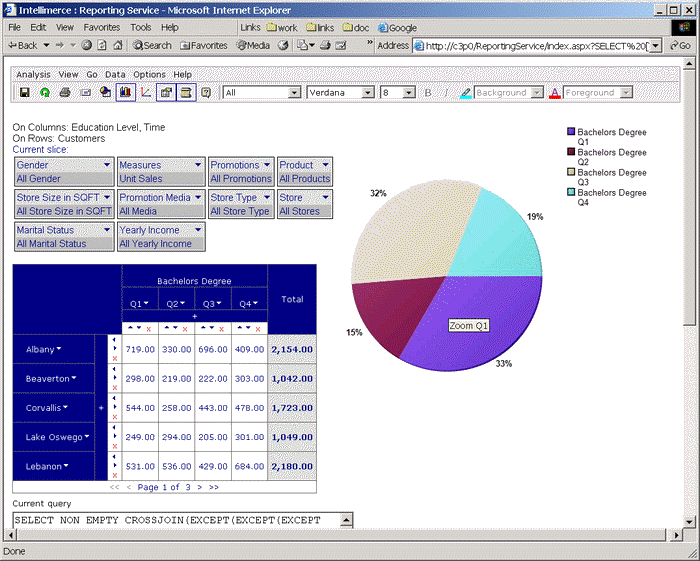
There is no drill-up option available in the charts currently (you can use the browser back button instead).
|
|
