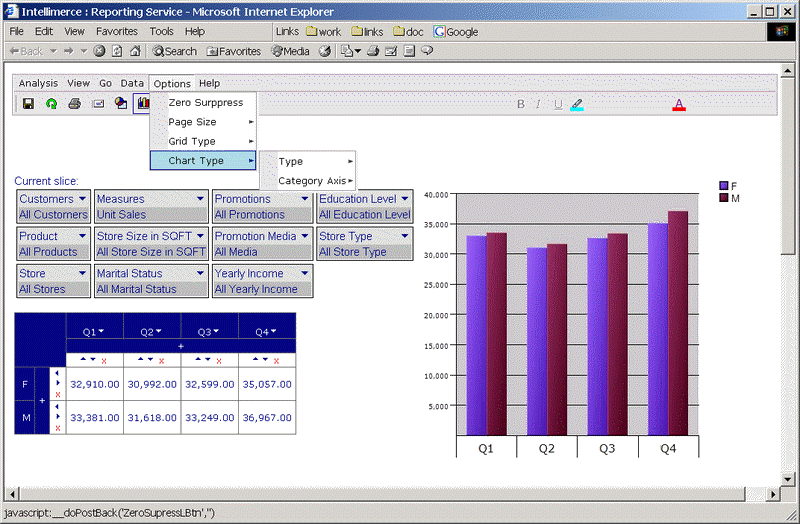
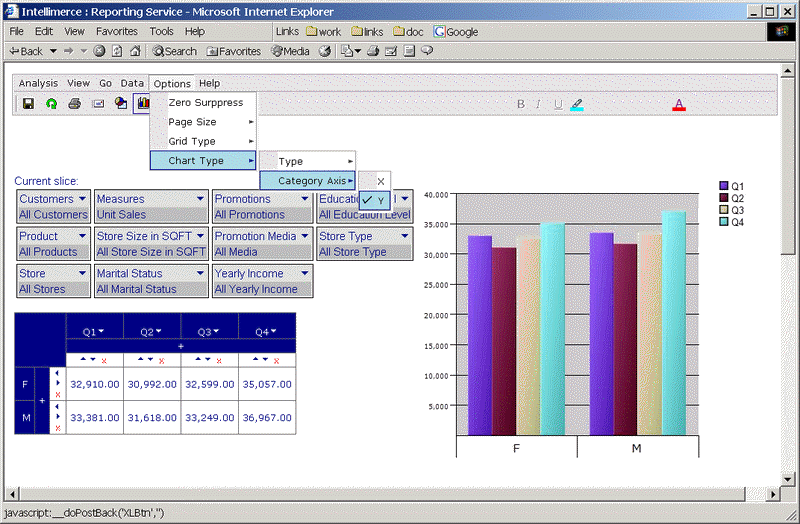
In the Chart Type option you have choice to change Type of the chart and Category Axis as shown in the following figure:

Choose from 15 different chart types, always synchronized with grid view. Chart Type from the menu is shown bellow with the list of 15 different chart types available:
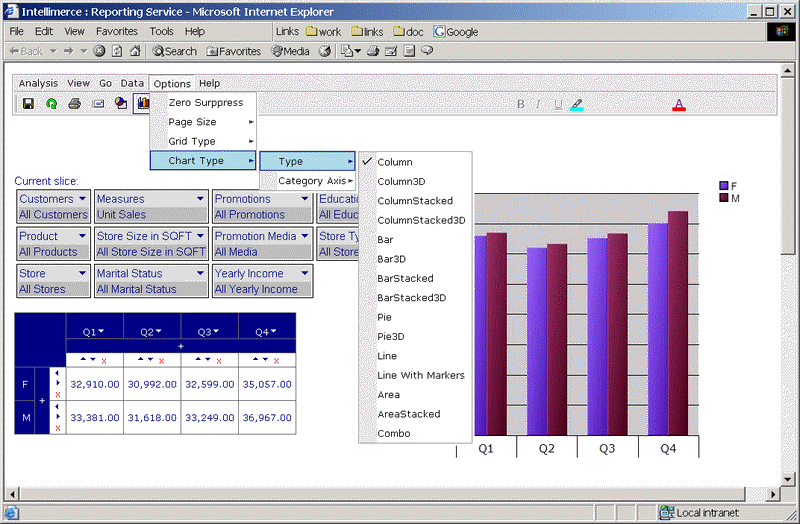
You can select any one of them by simply clicking on the Chart type combo box and selecting the desired type.
The changes will be applied immediately as shown in the example.
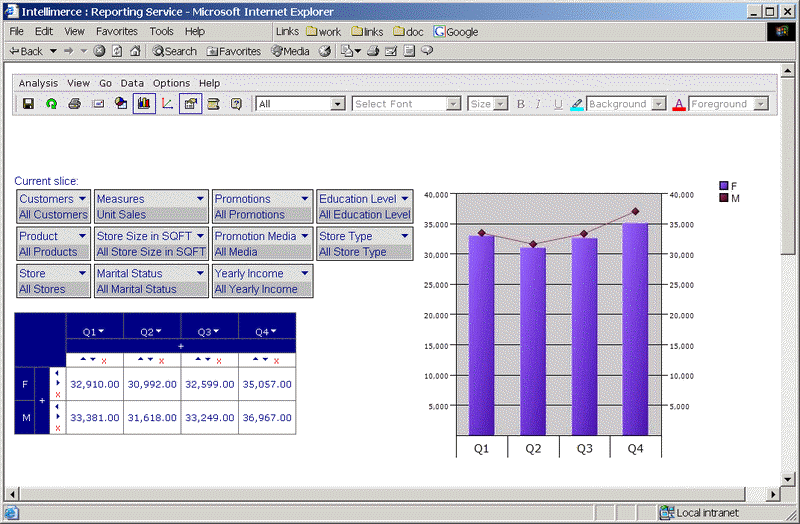
In the example is chosen Combo option where are line and bar displayed in the chart (combo displays first 2 data series, regardless of actual number of data series in input data).
Through the Options menu you can change also the category of the axis shown in the chart. The default value is X axis which means the time dimension is shown in the chart as follows:
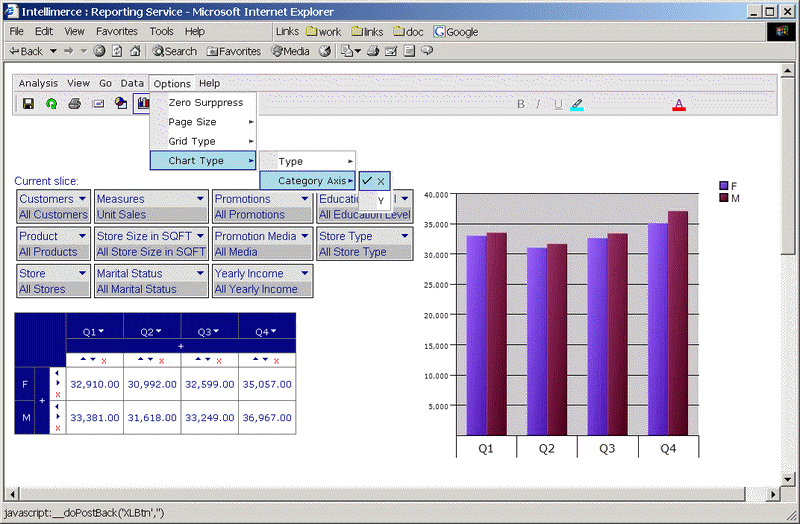
When Y axis chosen is shown bellow (male/female dimension):
See Also Invert Axis and Inverting Axes
|
|
